Unlocking Insights: Frequency Distributions Decoded
Frequency distributions are essential statistical tools representing data intervals. Graphical representations like histograms and bar charts visually display data distribution, aiding decision-making. Identifying patterns and outliers helps in deeper analysis. In finance, frequency distributions analyze price movements for market insights. Recognizing recurring patterns in trading helps manage risks and adjust strategies based on market volatility. The analysis of frequency distributions offers a powerful way to decode data patterns and make strategic decisions.
Key Takeaways
- Frequency distributions reveal data patterns for decision-making.
- Visual representations like histograms and bar charts aid in analysis.
- Insights from patterns inform trading strategies in finance.
- Understanding market behavior through price data probabilities.
- Statistical analysis guides risk management and trading decisions.
Overview of Frequency Distributions
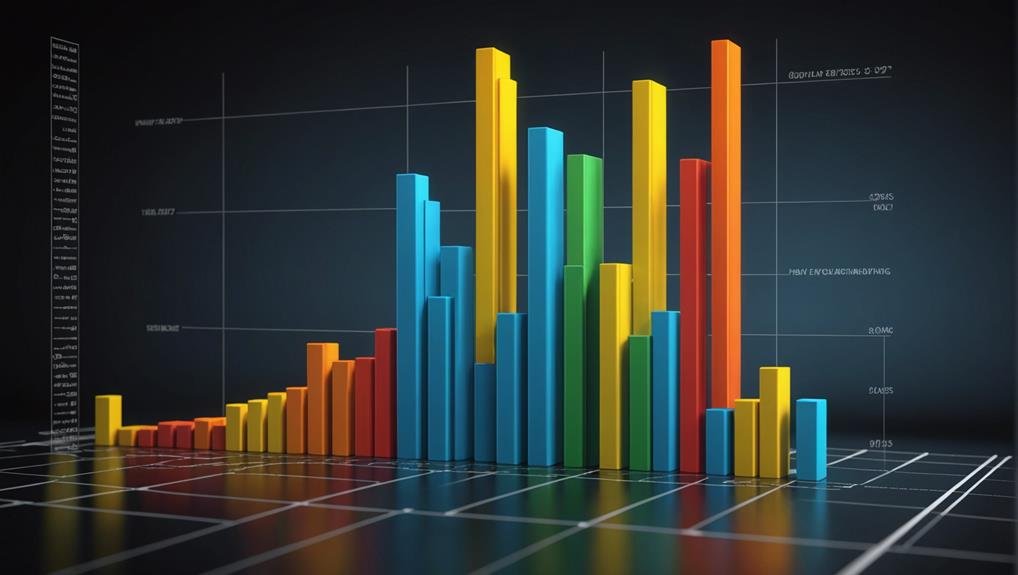
Frequency distributions play a vital role as a fundamental statistical tool for representing the distribution of observations within specified intervals. In frequency distribution analysis, data visualization techniques such as histograms and bar charts are commonly employed to visually display the distribution of data. These graphical representations provide a clear overview of how observations are distributed across different intervals or categories.
Histograms present the frequency count of each interval through columns, while bar charts display the measured variable against its frequency. Understanding frequency distributions is essential for interpreting the pattern of data, identifying outliers, and recognizing trends. By utilizing these data visualization techniques, analysts can gain valuable insights into the underlying distribution of the data and make informed decisions based on the observed patterns.
Importance in Data Analysis
For effective data interpretation and decision-making, understanding the significance of frequency distributions in data analysis is paramount. Statistical analysis relies heavily on frequency distributions to summarize the distribution of data and identify patterns. Data visualization through histograms or bar charts provides a clear representation of how often certain values occur within a dataset, aiding in the identification of trends and outliers. By organizing data into intervals and displaying the frequency of observations within each interval, analysts can quickly grasp the underlying patterns and make informed decisions. The table below illustrates the importance of frequency distributions in statistical analysis and data visualization:
| Importance in Data Analysis | Statistical Analysis | Data Visualization |
|---|---|---|
| Summarize data distribution | Identify patterns | Clear representation |
| Aid in decision-making | Organize data | Identify trends |
| Identify outliers | Analyze distributions | Highlight patterns |
Visualizing Data Patterns
Visual representations such as histograms and bar charts are essential in revealing underlying patterns in data sets. They help analysts in identifying trends and outliers effectively. When visualizing data patterns, two key elements come into play:
- Clarity: Clear visualization aids in better data interpretation.
- Insight: Patterns recognized lead to deeper understanding and analysis.
- Efficiency: Visual representations streamline the process of pattern recognition.
- Precision: Accurately depicting data patterns guarantees precise analysis.
Histograms and bar charts provide a structured approach to data interpretation, enabling pattern recognition through visual cues. Analysts rely on these tools to extract meaningful insights from complex datasets, facilitating informed decision-making processes.
Applications in Finance
Applications in Finance involve utilizing frequency distributions to analyze price movements and identify trends in the market. Statistical modeling is commonly applied to interpret these distributions, providing insights into market analysis.
Traders leverage frequency distributions to understand the distribution of price data and make informed decisions based on probabilities. By examining the frequency of price movements within various intervals, financial professionals can gain a deeper understanding of market behavior and potential future trends.
This analytical approach helps in identifying patterns, anomalies, and potential opportunities within the financial markets. Through the use of frequency distributions, traders can develop more sophisticated trading strategies and improve their overall performance in the market.
Insights for Trading Strategies
Traders can leverage insights gained from analyzing frequency distributions to enhance the effectiveness of their trading strategies. By incorporating trading indicators and market analysis, traders can make informed decisions based on statistical data.
Here are four key ways frequency distributions can benefit trading strategies:
- Identifying Patterns: Recognizing recurring patterns in price movements can help traders anticipate market trends.
- Risk Management: Understanding the distribution of risks can assist in implementing appropriate risk management strategies.
- Entry and Exit Points: Analyzing frequency distributions can aid in determining best entry and exit points for trades.
- Volatility Analysis: Frequency distributions provide valuable insights into market volatility, allowing traders to adjust their strategies accordingly.
Conclusion
To sum up, frequency distributions serve as a powerful tool in data analysis, offering invaluable insights into the distribution of variables and patterns within datasets.
From constructing intervals to visualizing data patterns, the significance of frequency distributions cannot be overstated.
Their applications in finance, particularly in identifying trends and probabilities for trading strategies, highlight their utility across various fields.
By deciphering the complexities of frequency distributions, one can access a wealth of information and make informed decisions based on data-driven analysis.