Gantt Chart Essentials for Project Management
Ever wondered why some projects fly high while others crash? The key often is using a project management tool like the Gantt chart. This tool does more than show project timelines. It helps managers break down big projects into smaller tasks and track progress easily.
For over a century, Gantt charts have grown from their 19th-century start. They’re now a top choice for many fields, from software making to marketing campaigns.
Today, Gantt charts give project managers a big boost. They help schedule tasks and see how they depend on each other in real-time. But what are the key parts to make the most of this tool? Let’s dive into the basics and see how this chart can change how you manage projects.
Key Takeaways
- The Gantt chart visually organizes project timelines and tasks for better management.
- First created by Karol Adamiecki in 1896, the Gantt chart was later popularized by Henry Gantt in 1910.
- Essential components include a task list, task durations, milestones, and resource allocations.
- Gantt charts are versatile and can be applied across various industries for effective project planning.
- They aid in tracking deadlines and monitoring progress through clear visualizations.
What is a Gantt Chart?
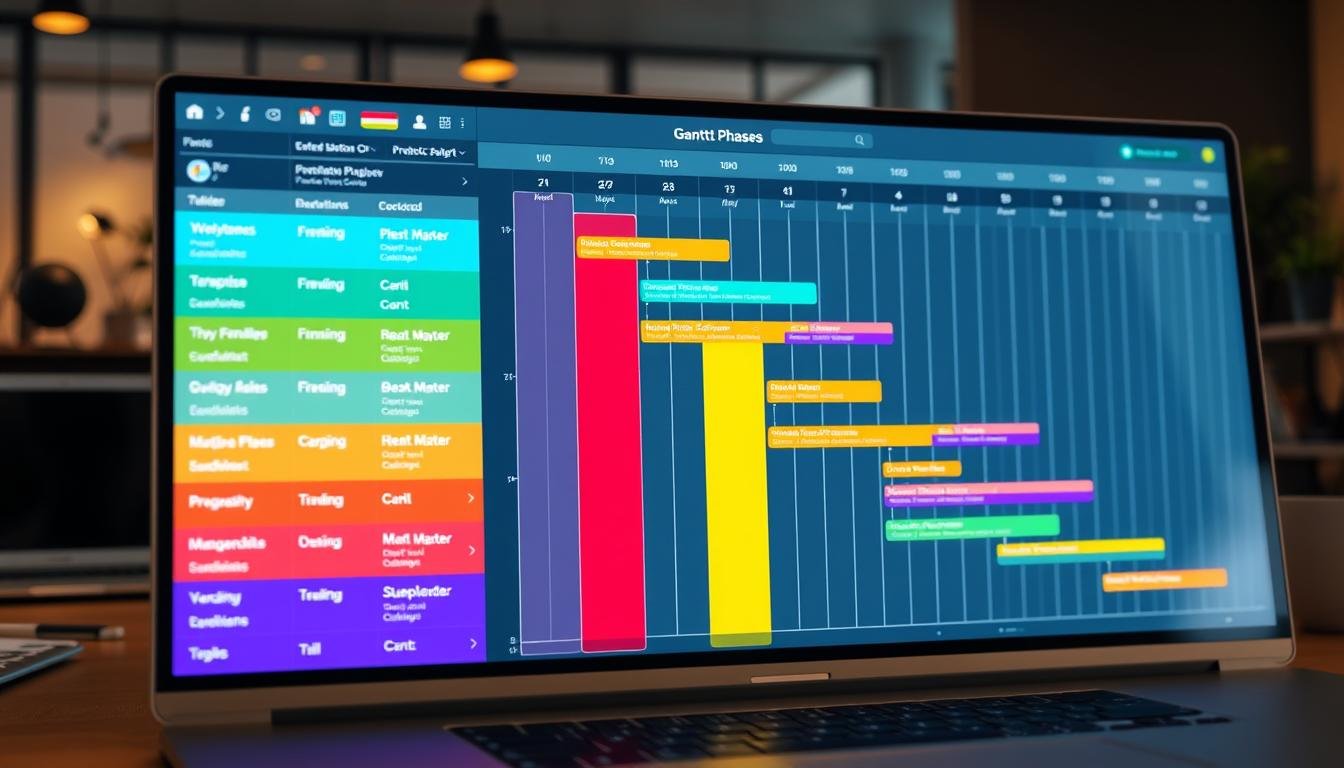
A Gantt chart is a key tool for planning projects. It shows tasks on an interactive timeline. It helps project managers schedule and track tasks, making it easy to see dependencies and milestones.
Tasks are shown as horizontal bars. The length of these bars tells us how long each task will take. This makes it simple to understand the planned activities.
Definition and Overview
The Gantt chart is a top tool for managing projects. Henry Gantt introduced it in the early 1910s. It helps managers see complex projects clearly.
It shows which tasks can be done at the same time, where bottlenecks might happen, and which tasks are less important. This makes it easier to talk about project plans and how to use resources.
Tools like Microsoft Visio and Excel help make Gantt charts. They help teams know who is doing what and how tasks are going.
History of the Gantt Chart
The idea of the Gantt chart started in 1896 with the harmonogram by Polish engineer Karol Adamiecki. But it became well-known thanks to American engineer Henry Gantt, who made it better.
Adamiecki’s work was ahead of its time, but it was hard to spread because of language barriers. Over time, Gantt charts went from simple drawings to complex software. Now, they are crucial in many fields, like building and making software.
Key Components of a Gantt Chart
A well-structured Gantt chart makes project management clear by showing key parts visually. It helps track tasks and manage resources better. The main parts are:
Task List
The task list is at the heart of a Gantt chart, on the left side. It lists all project tasks and who is responsible for them. Tasks can be broken down into smaller parts for a detailed look at what needs to be done.
This makes it easy for team members to see their roles in the project.
Task Bars and Durations
Task bars show each task as horizontal bars, colored for easy view. The length of each bar tells how long the task will take. This helps in planning and tracking project time well.
It makes managing time and checking progress easier, showing where the project stands.
Milestones and Dependencies
Milestones are key points in the project timeline, showing big achievements or deadlines. Dependencies show which tasks must be finished before others start. Knowing these helps keep the project moving smoothly and avoids delays.
Resource Allocation
Resource management shows which resources are working on each task. This makes it clear who is doing what, making sure everyone and everything is used well. It helps managers keep track of what resources are needed, improving the project’s success.
| Component | Description |
|---|---|
| Task List | Outline of all project-related tasks, showcasing responsibilities and sub-tasks. |
| Task Bars | Colored bars representing each task’s duration, facilitating project timeline visualization. |
| Milestones | Significant points in the timeline marking critical achievements and deadlines. |
| Task Dependencies | Indicates relationships between tasks, essential for maintaining workflow and managing the critical path. |
| Resource Allocation | Shows which resources are assigned to each task for effective task delegation and management. |
Benefits of Using a Gantt Chart for Project Management
Gantt charts are a big help in project management. They make it easier to track and manage projects. They show project timelines and how tasks are connected.
Improved Task Scheduling
Gantt charts help with scheduling by showing when tasks overlap. They organize tasks clearly, making it easier to decide what to do first. This helps finish projects on time and makes it clear how tasks are connected.
Enhanced Project Monitoring
Gantt charts give a clear view of how projects are doing in real time. This lets managers spot delays and problems early. Making changes quickly helps keep projects on track and on time.
Clear Visualization of Dependencies
It’s important to know how tasks depend on each other to avoid scheduling problems. Gantt charts show these dependencies clearly. This helps managers plan better and keep teams working together smoothly.
How to Create a Gantt Chart
Creating a Gantt chart starts with collecting all project info. You need to document tasks, guess how long they’ll take, and set start and end dates. It’s important to get your team involved early. Their input helps make the Gantt chart more accurate.
Gathering Project Information
First, list all tasks in your project. Think about how they depend on each other. Knowing these dependencies helps in making a solid plan.
Next, figure out what resources you’ll need, like people, materials, and tools. Then, guess how long each task will take. Using methods like Estimate-to-Complete helps in making a good Gantt chart.
Steps to Build the Chart
Use software like Microsoft Project, Primavera Project Planner, or MindView to build your Gantt chart. Put in tasks, dates, and how they depend on each other. Sometimes, you might need to speed up or slow down tasks to fit the timeline.
Keep an eye on how the project is going and update the Gantt chart as needed. Using colors to show task status makes the chart clearer and easier to use. Gantt charts are key for managing big projects well.
Source Links
- What is a Gantt Chart? Guide to Project Timelines [2024] • Asana
- What Is a Gantt Chart? 7 Examples for Project Management
- What Is A Gantt Chart? The Ultimate Guide
- Gantt Chart: Definition, Benefits, and How It’s Used
- No title found
- What is a Gantt Chart? Pros, Cons, Examples + Alternatives [2024]
- The Gantt Chart: Its Components, Uses and Benefits Explained
- What Is a Gantt Chart? (Examples & Templates)
- The Pros and Cons of Gantt Charts | Smartsheet
- Importance of Gantt Charts in Project Management
- How to Create a Gantt Chart
- Excel Gantt Chart Tutorial + Free Template + Export to PPT
- How to Create a Gantt Chart for Effective Project Management