Fishbone Diagram (Ishikawa): Solve Problems Visually
Have you ever felt like traditional ways to solve problems don’t quite hit the mark? The Fishbone Diagram (Ishikawa), or Cause and Effect Diagram, changes that by showing possible causes of a problem. It helps teams see the big picture when tackling issues. Created by Dr. Kaoru Ishikawa in the 1960s, this tool breaks down complex problems into smaller parts. It makes brainstorming and analyzing easier for teams in all kinds of industries.
This article will take a closer look at the Fishbone Diagram’s structure and its history. We’ll see how it’s used for quality improvement. By using it, your team can find the real causes of problems, not just the symptoms. This can make solving problems much more effective.
Key Takeaways
- The Fishbone Diagram is essential for visualizing complex problems.
- It helps identify multiple root causes contributing to issues.
- Combining the Fishbone Diagram with the “five-whys” technique can deepen root cause analysis.
- This tool promotes teamwork by encouraging all members to participate in discussions.
- Digital tools enhance the diagramming process for greater efficiency.
- The Fishbone Diagram is used in many industries, including healthcare and education.
Introduction to the Fishbone Diagram
The Fishbone Diagram (Ishikawa) is a key tool for Root Cause Analysis. It helps teams break down complex problems into manageable parts. By sorting out possible causes, teams can find the main reasons behind issues.
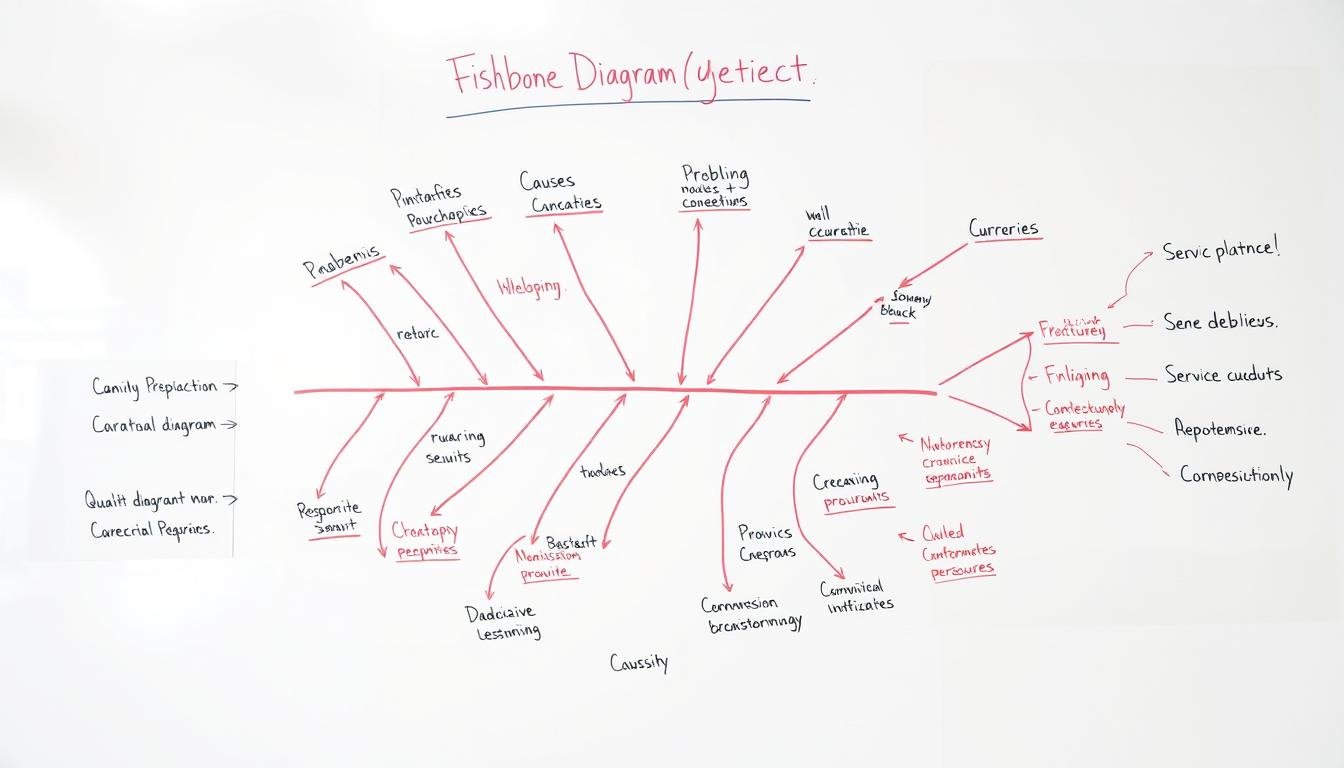
What is a Fishbone Diagram?
A Fishbone Diagram is like a guide for team brainstorming. It has a central “spine” for the main problem and “bones” for possible causes. These bones group into three main areas:
- PPPS major causes: People, Process, Platform, and Culture, important in office or professional settings.
- 5 Ms major causes: Machine, Method, Material, Man, and Measurement, for the manufacturing world.
- 5 Ps major causes: Product, Price, Promotion, Place, and People, useful for product marketing.
History of the Fishbone Diagram
The Fishbone Diagram started in the 1920s, thanks to Kaoru Ishikawa at Kawasaki shipyards. Ishikawa showed it could be used in many industries, not just manufacturing. Now, it’s used in marketing, product development, and improving processes.
Teams find it useful for solving problems, brainstorming, and looking at customer feedback. The Fishbone Diagram makes complex info easy to see and share. It helps teams work better together and understand issues deeply.
| Groups of Major Causes | Relevant Environments |
|---|---|
| PPPS | Office or Professional Services |
| 5 Ms | Manufacturing Sector |
| 5 Ps | Product Marketing |
Understanding the Structure of the Fishbone Diagram
The Fishbone Diagram, also known as the Ishikawa Diagram, is a key Quality Management Tool for finding root causes. It helps teams look at all the factors that lead to a problem. Knowing how it works is key to using it well to understand problems deeply.
Components of the Fishbone Diagram
The Fishbone Chart has a simple yet detailed structure. It includes several important parts:
- Head: Shows the main problem or effect being looked at.
- Spine: A central line that connects to the head and has various categories.
- Bones: Major cause categories that branch off the spine. Each bone stands for different areas like People, Process, Equipment, Materials, Environment, and Management.
- Sub-bones: These go deeper into the main categories, showing more possible causes or sub-causes of the main issue.
- Causes: Specific reasons found through brainstorming that might cause the problem.
How to Read a Fishbone Diagram
Reading a Fishbone Diagram means following a step-by-step method. The aim is to see which categories and sub-causes are most related to the main issue. Start with the head to grasp the problem, then move along the spine to see how each category adds to it. This makes it clear how causes lead to effects, aiding teams in focused talks and agreeing on the main issues.
For example, Mazda Motors used the Fishbone Diagram during the Miata’s design phase. This method helps in a thorough check of various factors.
Using the Fishbone Diagram encourages teamwork in solving problems. It helps tackle potential causes step by step, making the problem-solving process better. While it has big benefits as a Quality Management Tool, it’s important to keep the diagram clear and focused. This way, the real root causes are clear, helping in making effective solutions.
Fishbone Diagram (Ishikawa): Its Applications in Problem Solving
The Fishbone Diagram, also known as the Ishikawa Diagram, is a key tool for solving problems. It helps teams find and fix the main causes of issues. Its design makes it easy to understand and work together, making it vital in many fields.
Utilizing the Fishbone Diagram in Quality Management
In Quality Management, the Fishbone Diagram is very important. It breaks down problems into main cause groups like people, methods, machines, materials, measurement, and environment. This method helps teams deeply analyze issues and focus on key areas to improve.
Companies use it to make sure their quality is high and processes run smoothly. It helps make decisions based on data, leading to better products and services.
Example Use Cases of the Ishikawa Diagram
Many industries use the Fishbone Diagram to solve problems effectively. Here are some examples:
| Industry | Application | Benefits |
|---|---|---|
| Manufacturing | Identifying quality defects during production | Enhances defect analysis and reduces waste |
| Healthcare | Improving patient care processes | Streamlines operations to minimize errors |
| Software Development | Troubleshooting bugs in applications | Facilitates quick resolution of coding issues |
| Project Management | Identifying risks in project delivery | Supports proactive risk mitigation strategies |
These examples show how the Fishbone Diagram is a versatile tool in Quality Management. It broadens the view on issues, promotes teamwork, encourages creative thinking, and helps in focusing on solving problems.
Steps to Create an Effective Fishbone Diagram
Creating a Fishbone Diagram needs careful planning and teamwork. This Problem Solving Technique helps teams talk about issues in a structured way. Start by clearly defining the problem you want to solve. This helps the team focus on the right topics.
Then, set up main cause categories to guide the brainstorming. This makes it easier to explore each part of the problem.
Preparing for a Team Brainstorming Session
A good brainstorming session brings together different ideas. Use categories like machinery, environment, and people to start. These categories help you dig deeper into the issue.
Ask your team to think about possible causes in these areas. Using the 5 Whys method can make the discussion more insightful. This leads to better Root Cause Analysis.
Tips for Organizing Causes and Categories
When you start listing ideas, it’s important to organize them. Use pictures to show the ideas in a Cause and Effect Diagram format. Put causes in their categories for better understanding.
Make sure the causes really show the problems found during brainstorming. If categories change, update the diagram to keep it true to the team’s discoveries.
| Fishbone Diagram Types | Description |
|---|---|
| Simple Fishbone | Basic format for identifying causes without complex categorization. |
| 4S Fishbone | Organizes causes into Systems, Surroundings, Skills, and Suppliers. |
| 8P Fishbone | Considers Physical Evidence, Personnel, Place, Product, Price, Promotion, Process, and Productivity/Quality. |
| Man Machines Materials | Commonly used in manufacturing to examine equipment and resources. |
By following these steps, teams can make a Fishbone Diagram. This tool is great for solving problems and improving processes in many areas.
Conclusion
The Fishbone Diagram, also known as the Ishikawa, is more than just a tool. It’s a powerful way to solve problems in many fields. It shows how causes and effects are linked, helping teams find the real reasons behind issues. This makes it a key tool for lasting improvement.
In manufacturing and services, the Fishbone Diagram helps sort out possible causes. For manufacturing, it looks at Machines, Methods, and People. For services, it focuses on Policies, Procedures, and Plant. This method helps teams understand problems better and pushes for ongoing quality improvement.
Using the Fishbone Diagram with tools like Tulip lets teams spot and track issues. This way, they can see how problems affect their work. It helps teams focus on the real causes, not just the symptoms.
This method gives teams a clear way to tackle problems. It ensures actions are quick and effective in improving quality. Making the Fishbone Diagram a standard practice can make solving problems easier and improve overall performance.
Source Links
- How to Use the Fishbone Tool for Root Cause Analysis
- What is a fishbone diagram?
- The Fishbone Analysis Tool (Ishikawa Diagram): A Simple Intro – The World of Work Project
- Ishikawa Diagram: A Guide on How to Use It | SafetyCulture
- Fishbone Diagram Explained | Reliable Plant
- How to Make a Fishbone Diagram: The Ultimate Guide
- Fishbone Diagram | Ishikawa Diagram | Cause & Effect Diagram
- Using Fishbone Diagram and 5 Whys
- Ishikawa Diagram
- How to make a fishbone diagram
- How to Create a Fishbone Diagram?
- Fishbone Diagram: Cause and Effect Analysis Using Ishikawa Diagrams
- Fishbone (Ishikawa) Diagram Template For Root Cause Analysis
- Fishbone Diagrams for Beginners | What is a Fishbone Diagram?